Weather Analysis
To make effective irrigation decisions, a grower has to know exactly what has and will happen with respect to the weather, as accurately as possible. On-farm monitoring and easy access to the data and related analyses are the optimal solution.
The maps and tools below are created through interpretation of the site-specific data collected and forecast for each station location in the ONpotatoes.ca network. They are designed to help you make smart and efficient irrigation decisions by turning numbers into pictures that “make the data dance.”
“Last 24 Hours” Rainfall Map
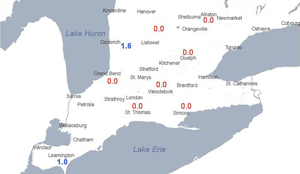
- At-a-glance view of precipitation amounts for southwestern Ontario
- Displays total covering 24-hour period as of the last data transmission from each station
Daily Rainfall Map, Observed, Historic & Forecast Weather
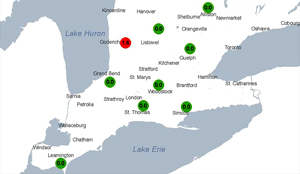
- Map shows the precipitation totals from each station
- Default view displays yesterdays readings
- Date selectable for as far back as data exists
- Click each location for station-specific detailed weather observations, forecasts and historical data (see below)
Station-Specific Recent Weather Overview
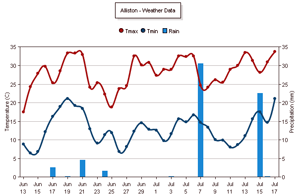
- A full month’s look back at the location’s weather
- Daily recorded precipitation, high and low temperatures from the station
- Useful view for examine recent trends, extreme weather events
Station-Specific Weather Forecast
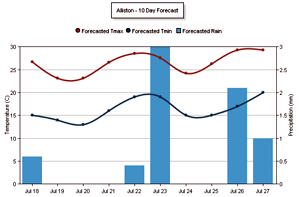
- 10-day forecast for each location
- Daily expected precipitation, high and low temperatures
- Forecasts provided by an independent service and updated daily
Station-Specific Historical Weather Data
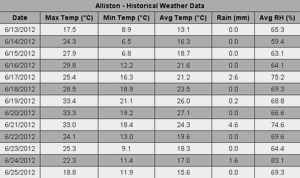
- One month’s recorded data from each station
- Daily high, low and average temperature, rainfall and average relative humidity
- Presented in raw chart form for those who prefer it or wish to use for further analysis