Soil Moisture Analysis
How much water is currently available in the soil? How much water are plants currently using, and at what depths? How much moisture is the soil losing due to evaporation? The following tools will help you answer these and other important questions with a few quick checks.
The screenshots below are examples of the analysis output to illustrate the ease with which you can quickly view these tools as part of your irrigation decision-making process. Note that the actual near-real-time soil moisture graphs are only available to growers with monitoring equipment on their farm and a login for the site.
Soil Moisture Profile

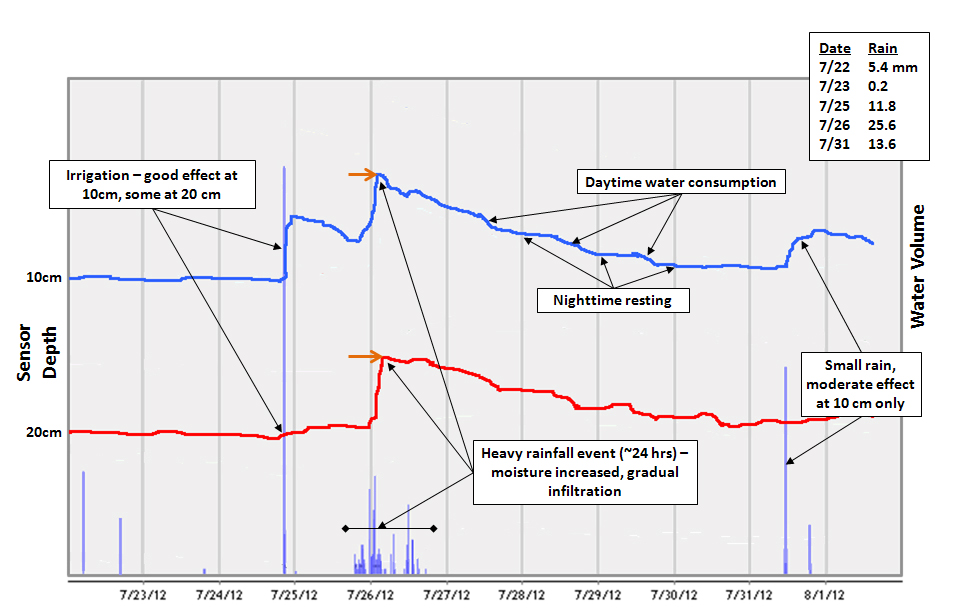
The horizontal lines indicate the moisture at each depth where a sensor is placed on the soil moisture probe. Each line has its own Y-axis scale – they are stacked to give provide easy interpretation of how water events (shown as purple vertical bars) reach and affect each depth.
Soil Moisture Sum

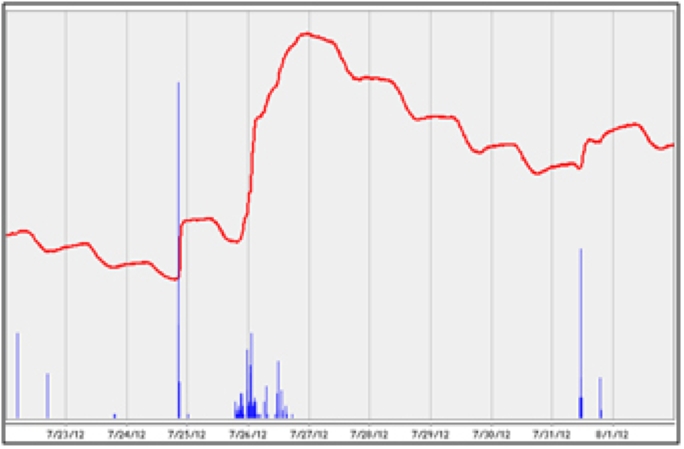
- Represents same weekly time span as Profile Graph
- Shows the overall total of available moisture throughout the entire monitored depth
Daily Evapotranspiration Map/Graph

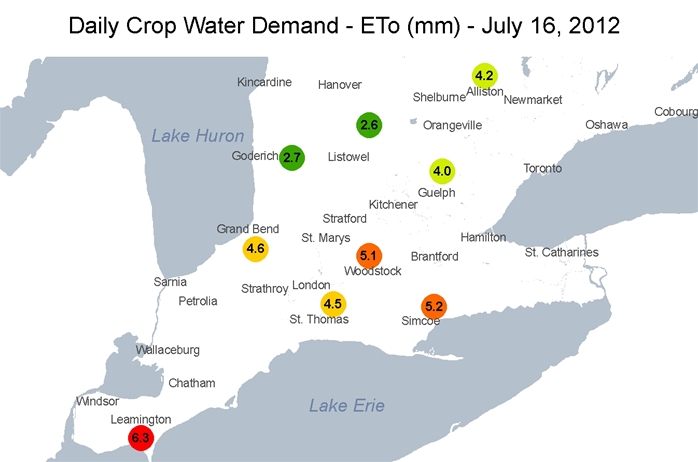
- Daily calculated evapotranspiration for each station in the network
- Represents the moisture taken away from the soil due to consumption by the plants (transpiration) and weather factors (evaporation -heat, wind, etc)
- Click on a location for more detailed analysis